 Nathan Jones

13
BYE
RIC GWS
SYD
STK
3:15PMSUN
June 07
SCG
ESS
CAR
7:20PMSUN
June 07
MCG
COL
MEL
3:15PMMON
June 08
MCG

Ads provide web developers the support to continue providing their services. If our ads are of annoyance, please provide recommendations to help us improve.
Nathan Jones
DT Average Against the Opposition
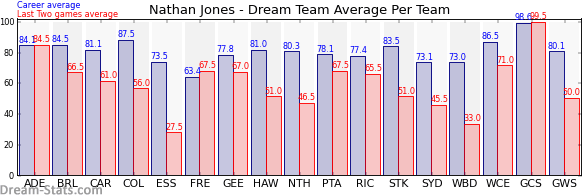
| Team | Games | Last 2 Avg. | Overall Avg. | Difference |
|---|---|---|---|---|
| Gold Coast | 13 | 99.5 | 98.6 | 0.9 |
| Adelaide | 17 | 84.5 | 84.1 | 0.4 |
| West Coast | 17 | 71.0 | 86.5 | -15.5 |
| Port Adelaide | 19 | 67.5 | 78.1 | -10.6 |
| Fremantle | 20 | 67.5 | 63.4 | 4.1 |
| Geelong | 19 | 67.0 | 77.8 | -10.8 |
| Brisbane | 17 | 66.5 | 84.5 | -18.0 |
| Richmond | 20 | 65.5 | 77.4 | -11.9 |
| Carlton | 16 | 61.0 | 81.1 | -20.1 |
| Collingwood | 21 | 56.0 | 87.5 | -31.5 |
| St. Kilda | 23 | 51.0 | 83.5 | -32.5 |
| Hawthorn | 19 | 51.0 | 81.0 | -30.0 |
| Western Sydney | 12 | 50.0 | 80.1 | -30.1 |
| North Melbourne | 21 | 46.5 | 80.3 | -33.8 |
| Sydney | 15 | 45.5 | 73.1 | -27.6 |
| Western Bulldogs | 21 | 33.0 | 73.0 | -40.0 |
| Essendon | 11 | 27.5 | 73.5 | -46.0 |
Ads provide web developers the support to continue providing their services. If our ads are of annoyance, please provide recommendations to help us improve.